
Estimated revenue and MarketScore™: compare markets without adding TAM twice
TrendMetric Research8 min read
Trending Markets scores markets and submarkets on their own. MarketScore™ is a 0–100 rank from stored demand, momentum, and competition. Estimated revenue is a modeled monthly range for comparison. Neither figure is observed checkout, ad spend, or Shopify revenue.
The failure mode is always the same: someone adds the parent to the child and calls it extra TAM, or treats a large modeled range as money they can capture. TrendMetric will not do that addition for you. Your notes should not do it either.
Use this article when you need a size check before spend or before you fall in love with a SKU. Media buyers should start here. If you already have a product idea, pair this pass with validate before ads. Country rules live in Worldwide vs country demand.
Independent scores
A submarket sits under a parent so you can zoom in. The child is not extra money on top of the parent. Compare siblings, then inspect the parent when you need the wider category. Brand owners use that hierarchy when a SKU sits in a tight intent inside a larger aisle.
Protein powder is a useful parent on the market board: Stable, with a modeled monthly range large enough that operators notice it. A shaker or another accessory in that aisle is not a second helping of that range. Read the accessory on Trending Products. Read the parent on Trending Markets. Write both. Add neither.
Holiday decor and folding furniture on the same card list show why status and range have to be read together. One can look Seasonal with a wide modeled band. The other can look smaller and still be the cleaner test if you need a less calendar-tied aisle. Mattresses and daily vitamins can sit in similarly large bands and still be different bets once you read competition and 30D.
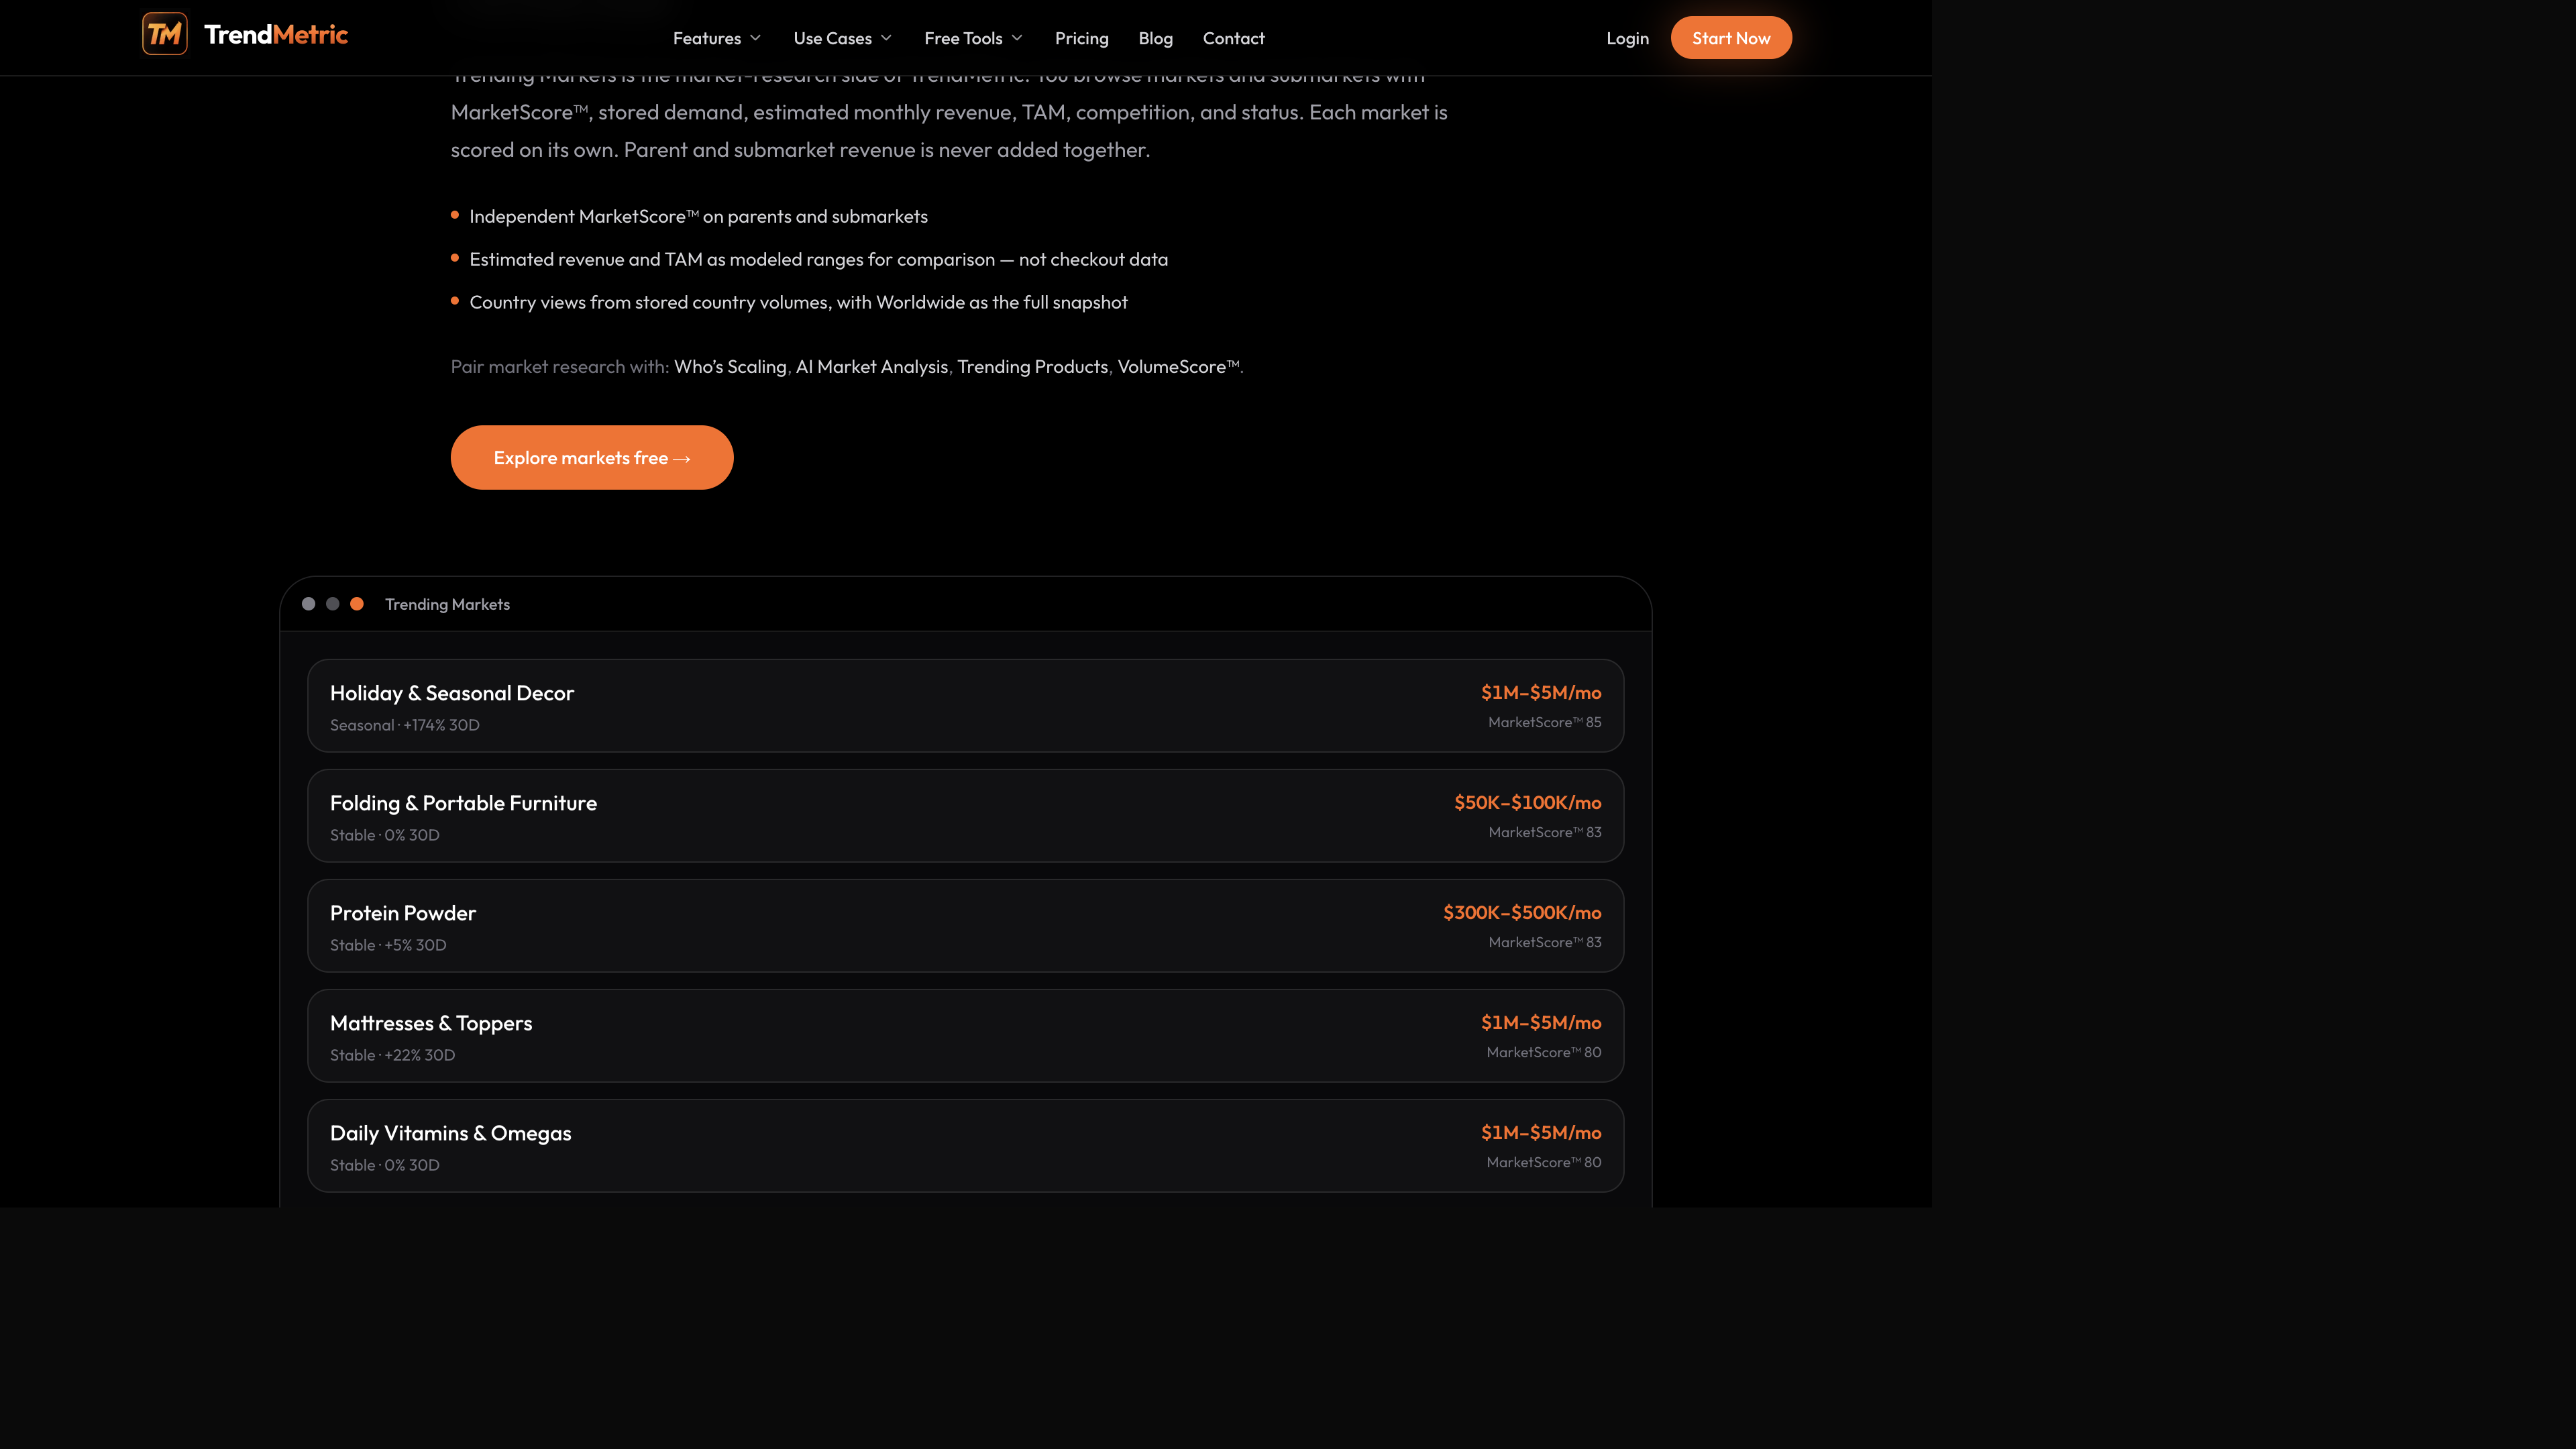
How estimated revenue is displayed
Worldwide uses stored market tiers. A country uses finer country buckets and the same TAM ceiling as the rest of the stack. Switching country reuses stored country volumes. It does not invent a series from 30D or 90D.
Treat the range as a way to see whether a market already looks large enough to care about, then validate with your own tests. A $300K–$500K style band next to a $1M–$5M style band is a comparison, not a promise that either number will hit your store. The workspace is ranking modeled opportunity, not reporting merchant payouts.
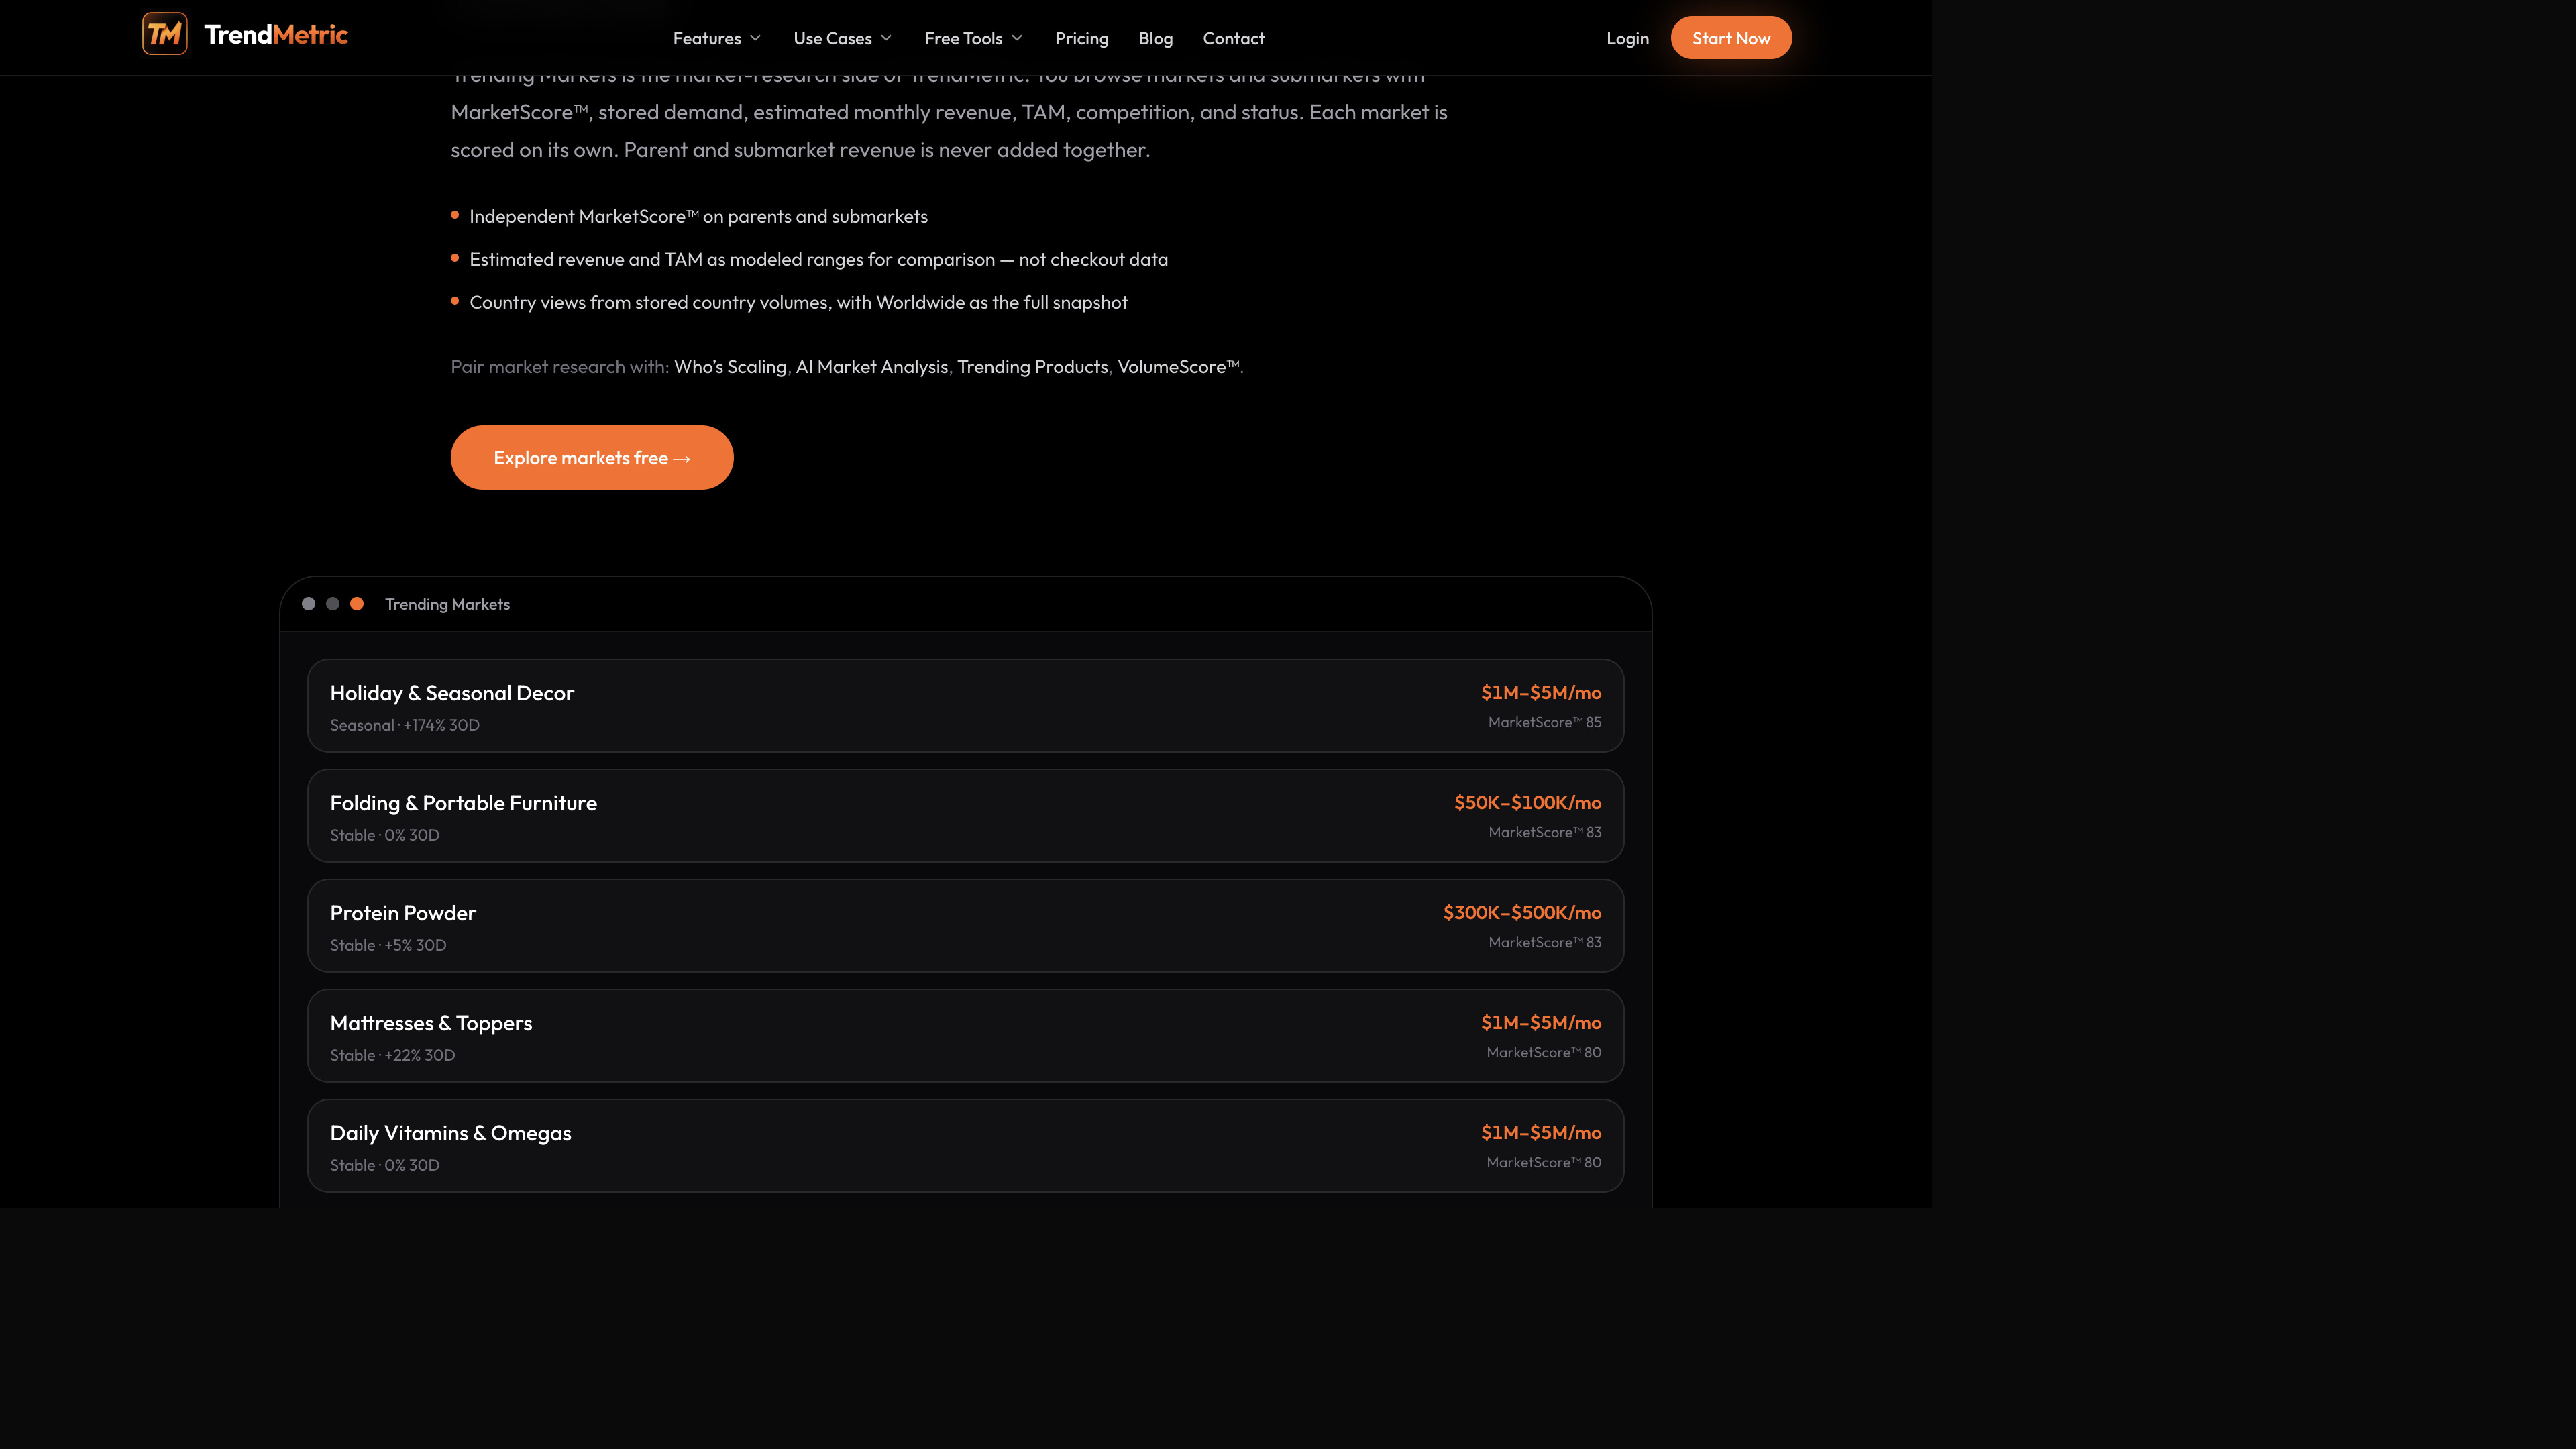
Sparklines use stored months
Where a compact revenue curve appears, it is built from stored monthly snapshots for that market. One stored point means you see the current value and no fake curve. Two or more points scale to that series’ own min and max — not a $0 baseline. TrendMetric does not synthesize a pretty line from 30D or 90D percentages.
What MarketScore™ is not
It is not a profit forecast. It is not VolumeScore™ — that rank belongs to products on Trending Products. A high MarketScore™ with Cooling status is a different read than Breakout with High competition. Status labels (Breakout, Emerging, Stable, Cooling, Seasonal) describe stored momentum, not a guarantee that the next month will look the same.
- Stable plus a large modeled range: the aisle already exists. You are entering, not discovering.
- Seasonal plus a large range: calendar risk. Do not staff a January brief off a December band.
- Breakout or Emerging: stored momentum is up. Pair it with the revenue range so a tiny base cannot look like scale.
- Cooling: the series is fading. Useful if you are buying leftover demand; a poor brief if you needed growth.
Competition on the market row is crowding, not your account’s CPC. CPC on a product, when it exists, is a research estimate — not the live auction you will pay tomorrow.
A size-check pass you can run before spend
Use this when a niche is being pitched to you — by a creator, a supplier, or your own swipe file. The output is “large enough to learn from” or “too thin / too stacked to bother,” not a media plan.
- Open Trending Markets. Start on Worldwide unless the ad account country is already known.
- Sort or scan by MarketScore™ so the board has one consistent rank. Then read estimated revenue beside it.
- Identify the parent and the child. Write each range on its own line. Do not add them.
- Read status and 30D / 90D. Seasonal and Cooling change the brief even when the range looks large.
- Switch to the country of the account. Do not brief US spend off Worldwide TAM. Do not add country revenue to Worldwide revenue.
- If the market still looks large enough and you need the growth-and-revenue bar, open Who’s Scaling. Then Forecast a catalog product inside the market if you have Pro.
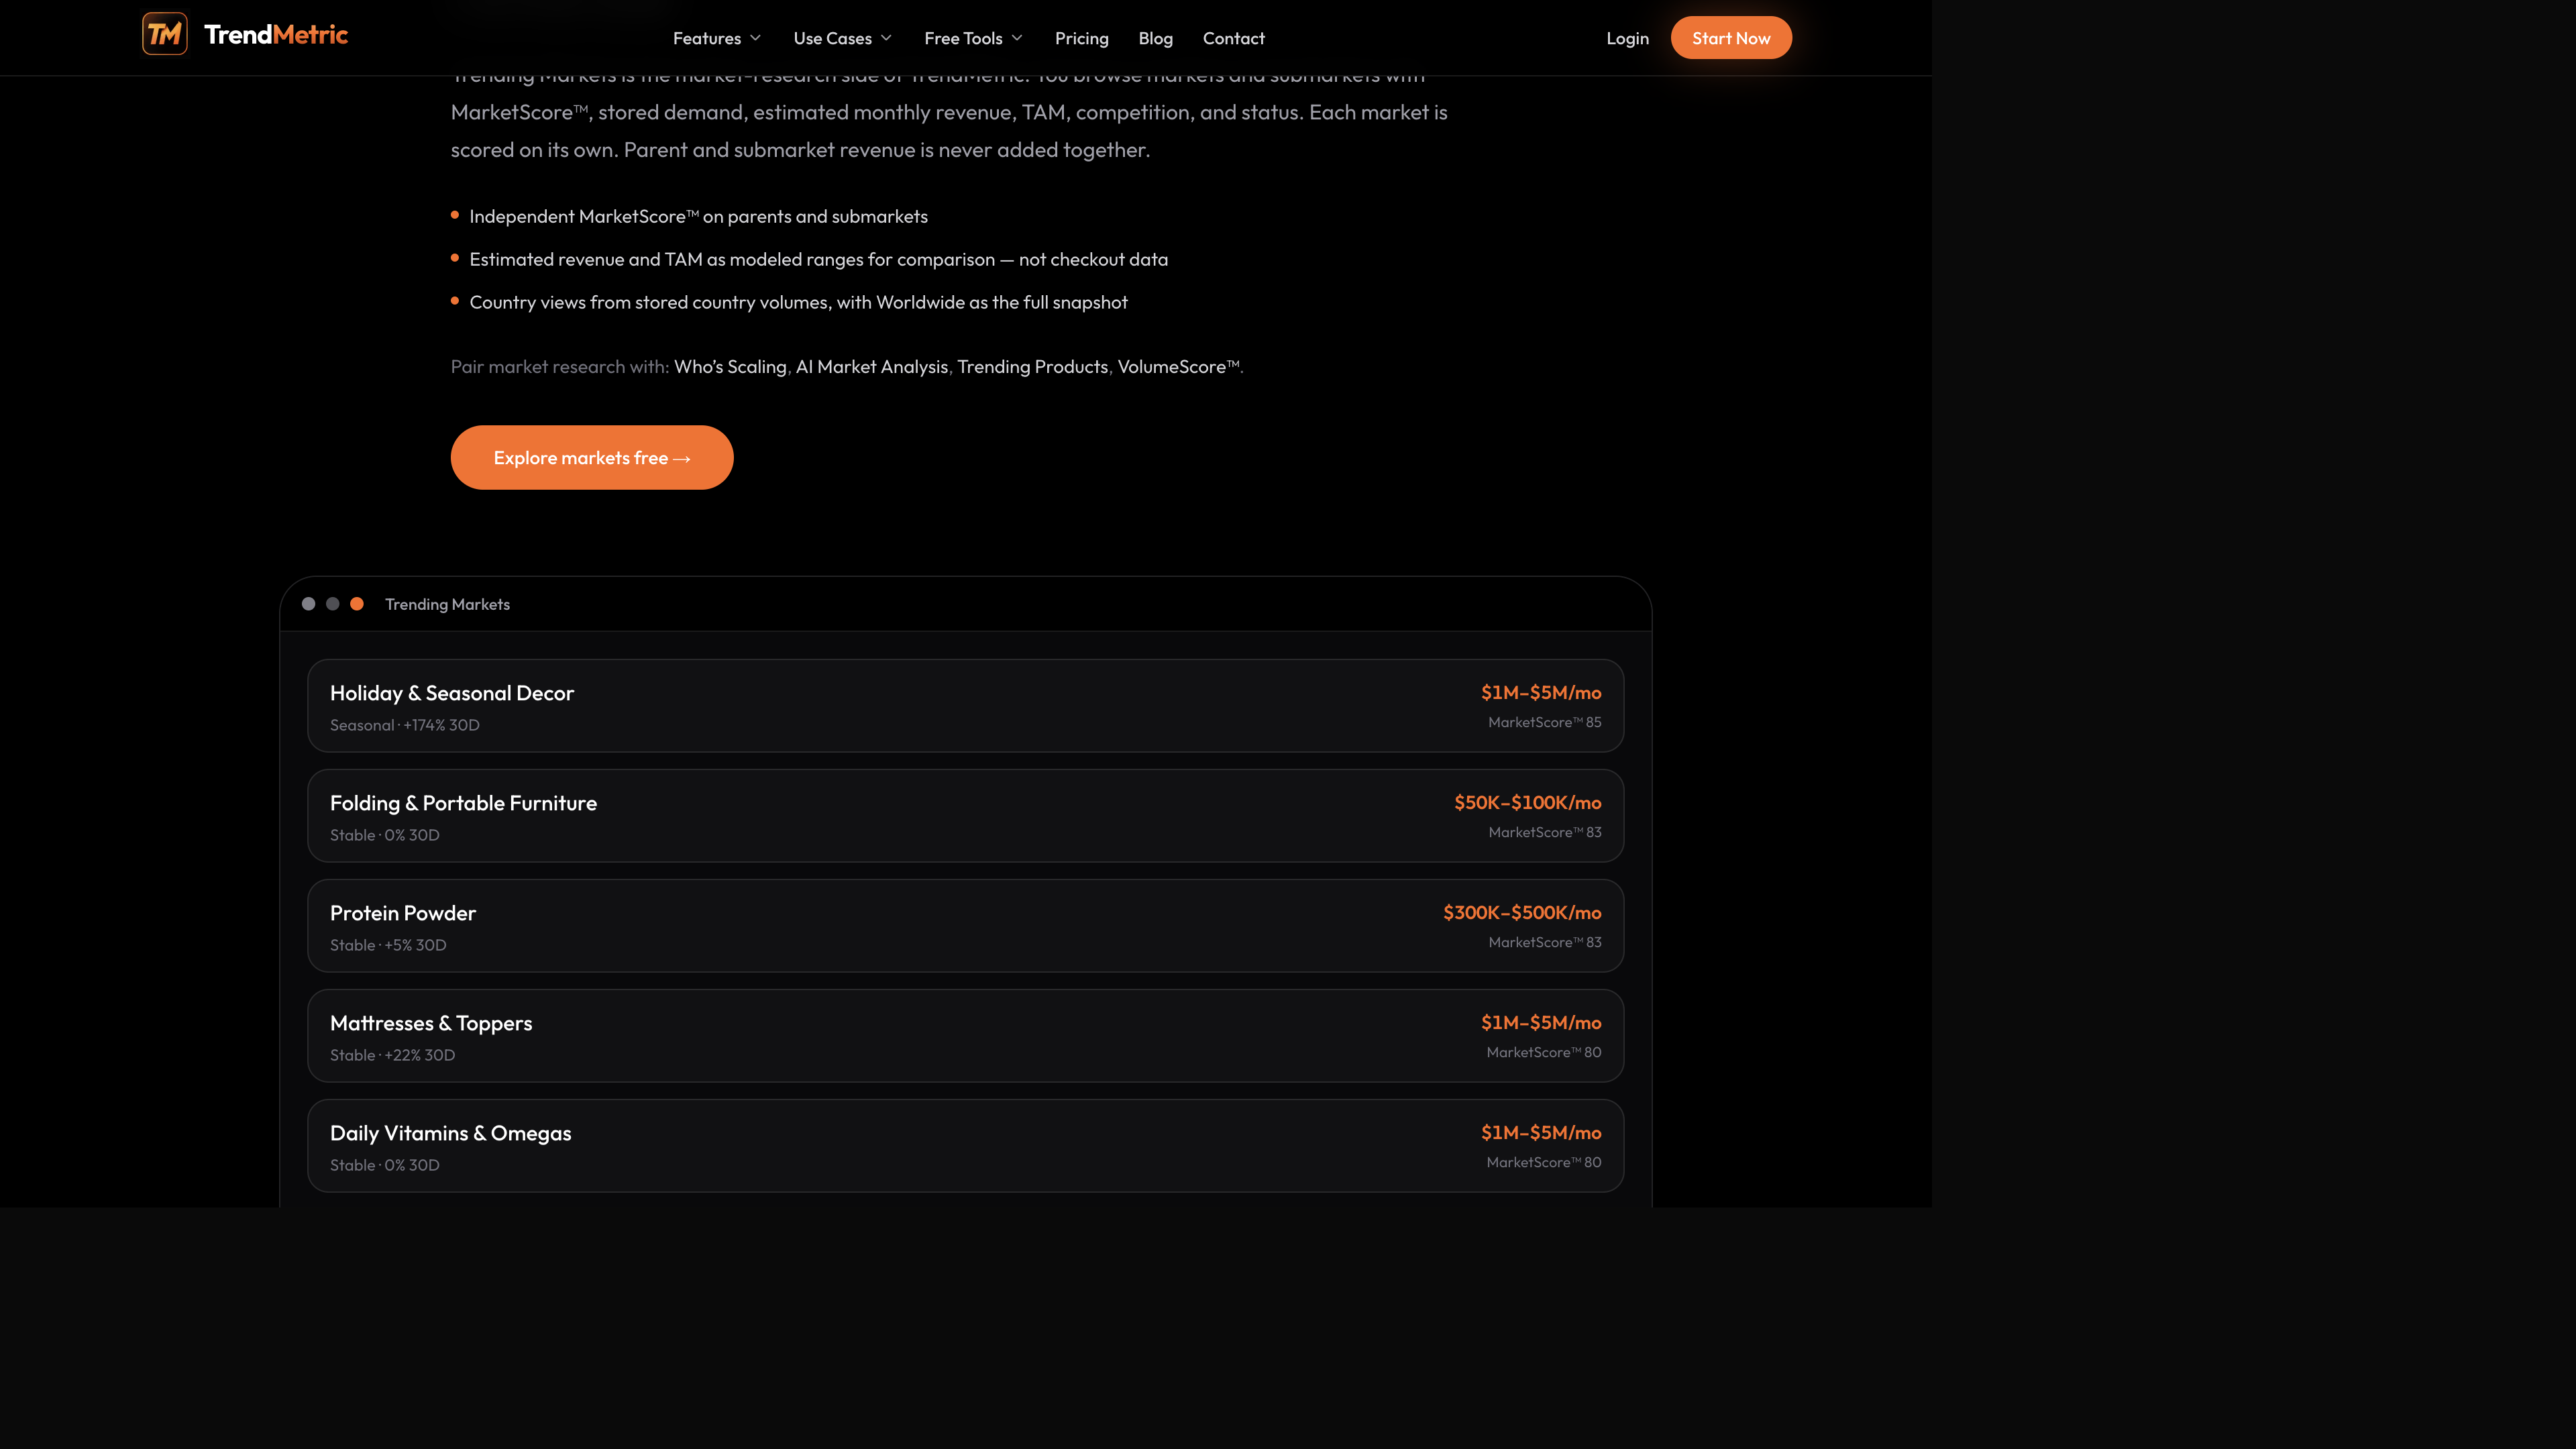
A walkthrough on the five cards
Use the Holiday Decor, Folding Furniture, Protein Powder, Mattresses, and Vitamins cards as a reading drill — not as a pick list. Holiday decor: Seasonal plus a wide modeled band. Ask whether your brief is in-season. Folding furniture: a smaller band can still be the cleaner test if you needed less calendar risk. Protein powder: Stable and large. You are entering an aisle, not discovering one. Mattresses and vitamins: large bands that still need competition and 30D before they become a media plan.
Write one line per card: status, modeled range, MarketScore™, and whether it is a parent you would zoom into. Then stop. If a supplier wants you to add those ranges into one “home and wellness TAM,” the honest answer is no. The workspace already refused to do it.
Who’s Scaling and AI briefs sit on the same numbers
Who’s Scaling answers a narrower question: which markets look like they are moving now, with enough modeled revenue that the movement matters. Small markets cannot rank highly from percentage growth alone. It is Pro. It is not a viral-product list and not a crawl of Shopify brands. Spy on Store is Coming Soon.
AI Market Analysis is a monthly-snapshot brief of the same board. It does not invent missing months. It does not replace live MarketScore™. Use it when you need language for a retainer, then open the live cards and check the ranges yourself.
Media buyers should still run this size check before they open Who’s Scaling. Ecommerce agencies should pick one country per client brief so a Worldwide range does not land in a local deck. Put that country on the project.
When to start on markets instead of SKUs
Start on Trending Markets when the question is “is this aisle large enough to learn from?” Start on Trending Products when you already have a SKU name. Media buyers usually need the aisle first. Product researchers usually have a shortlist and need the parent as context.
If a creator pitches “protein powder is exploding,” open the market card before you open a shaker SKU. If the card is Stable with a large modeled range, you are hearing a crowded aisle, not a discovery. If a supplier pitches folding furniture because a 30D percentage looks loud, check whether the modeled band is even large enough to staff. Who’s Scaling exists so tiny percentages cannot win on their own — but only if you have Pro and you already ran this board.
Do not skip the country switch on the market board either. A mattress aisle that looks large on Worldwide is not automatically that band in the country you buy ads. Country vs Worldwide is the same slice rule as products.
After the market looks large enough
Drop into Trending Products for SKUs inside the aisle. A protein-powder market can look large while the specific accessory you wanted looks thin and High competition. That is the point of keeping scores independent. VolumeScore™ ranks the product. MarketScore™ ranks the market.
Forecast a catalog product on a short horizon if you have Pro. Track the market and a handful of products so 7D / 30D has a start date. Track Forecast is not live. Compare pricing or which plan you need before you upgrade only to see a cut of a board Starter already includes.
If you already have a test budget, the ROI calculator and ROAS break-even calculator are arithmetic. They do not read MarketScore™. Use them after the catalog pass. The public trending markets tool is an entry point, not a second scoring engine.
Starter is enough for this size check. Upgrade only if you need Who’s Scaling, the AI monthly brief, or a Forecast range on a catalog SKU inside the market. Create a free account and compare two sibling markets without adding them together.
If the only number you needed was “is this aisle large enough,” you are done. Write the MarketScore™, the modeled range, the country, and whether the status is Seasonal or Cooling. That sentence is the brief. Adding a child TAM to make the sentence louder is how media plans get dishonest.
Related articles
FAQ
- Do you add parent and submarket revenue together?
- No. Each market is read on its own. Parent and submarket estimated revenue and TAM are never summed.
- Is estimated revenue real checkout data?
- No. It is a modeled monthly range for comparison. It is not observed checkout, ad spend, or Shopify totals.
- Is MarketScore™ a profit forecast?
- No. MarketScore™ is a 0–100 research rank from stored demand, momentum, and competition. A high score with Cooling status is a different read than Breakout with High competition.
- How is Who’s Scaling different from Trending Markets?
- Trending Markets is the full scored board. Who’s Scaling is a Pro ranking of markets that already clear a meaningful estimated-revenue floor and still show positive momentum.
- Which plans include Trending Markets?
- Starter, Pro, and Business all include Trending Markets on the same live catalog. Who’s Scaling, AI Market Analysis, and Forecast are Pro.